Lessons learned from the 2023 7th Grade Math STAAR
- Aaron Daffern
- Oct 29, 2023
- 5 min read
Updated: Feb 23, 2024
The 2023 7th Grade Math STAAR introduced statewide online testing and several new item types. Using a modified version of the statewide item analysis report, I examined the readiness standards that had less than 50% mastery. Each standard has both an analysis of the items themselves to infer what made them so difficult and instructional implications for educators to ensure a more successful 2024 STAAR test.
Standard | # of items | % mastery |
7.6G | 2 | 40.5 |
7.7A | 2 | 39.5 |
7.9C | 2 | 34 |
7.6I | 2 | 36 |
7.4A | 2 | 51.5 |
7.12A | 2 | 53 |
7.11A | 2 | 42.5 |
7.4D | 2 | 44 |
7.9B | 2 | 45.5 |
7.3B | 2 | 47.5 |
7.9A | 2 | 49 |
Access the slide deck here.
7.6G - 40.5% overall mastery
solve problems using data represented in bar graphs, dot plots, and circle graphs, including part-to-whole and part-to-part comparisons and equivalents
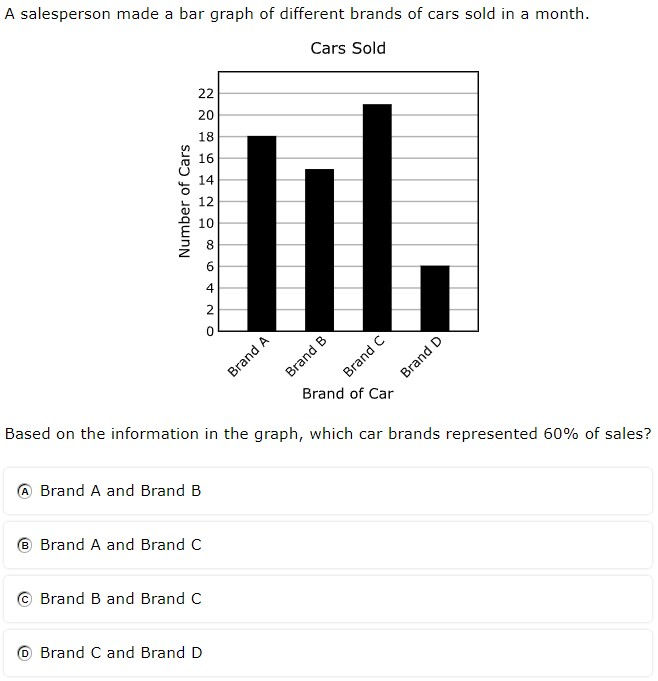
#12 - 32% correct
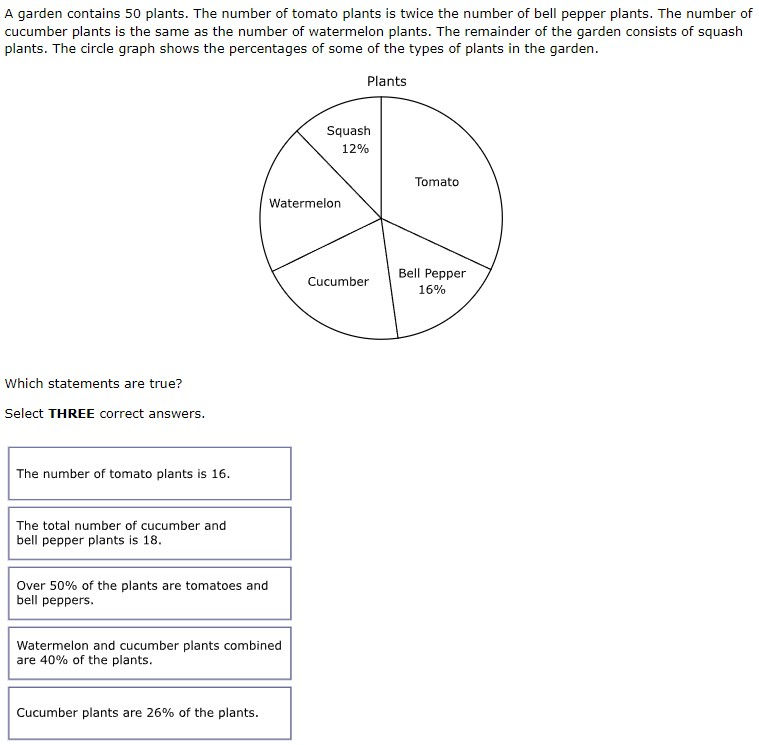
#28 - 25% full credit, 47% partial credit, 28% no credit
Analysis
Multiple successive operations used to find percent of a bar graph
Correct answer on the bar graph required adding two brands
Circle graph had to be converted from percents to actual numbers
Multiple select (choose three out of five) might have encouraged guessing
Instructional Implications
Practice finding percent of a whole (e.g., What is 16% of 50)?
When solving bar graphs, practice finding percent of the graph (e.g., 60% of total sales) by using combinations of categories (e.g., brand C and brand B)
When solving circle graphs, students should fill in the graph with a percent and an actual number for each category before answering the question
7.7A - 39.5% overall mastery
represent linear relationships using verbal descriptions, tables, graphs, and equations that simplify to the form y = mx + b
#7 - 52% correct
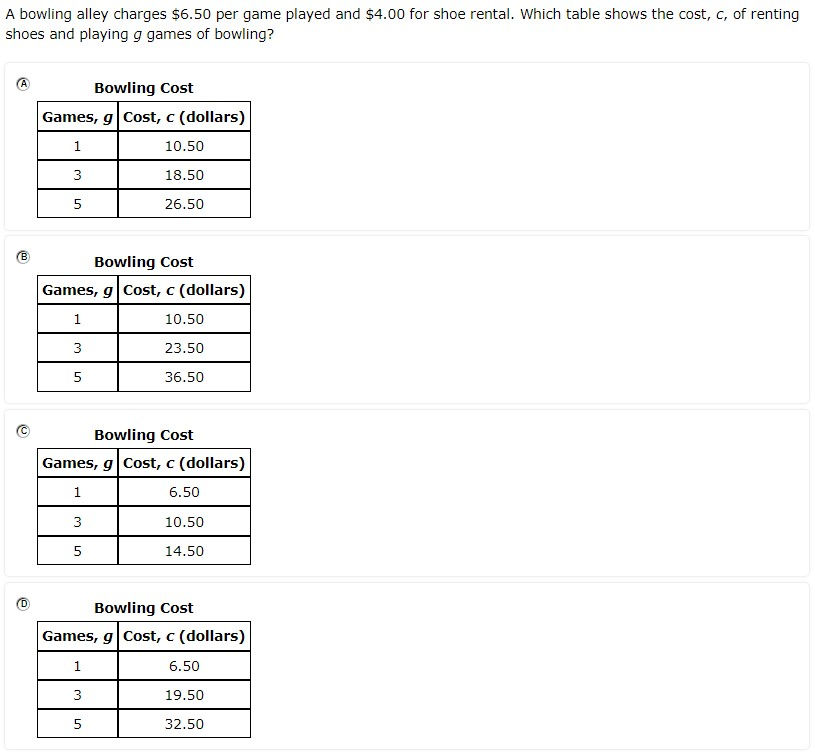
#25 - 12% full credit, 29% partial credit, 59% no credit
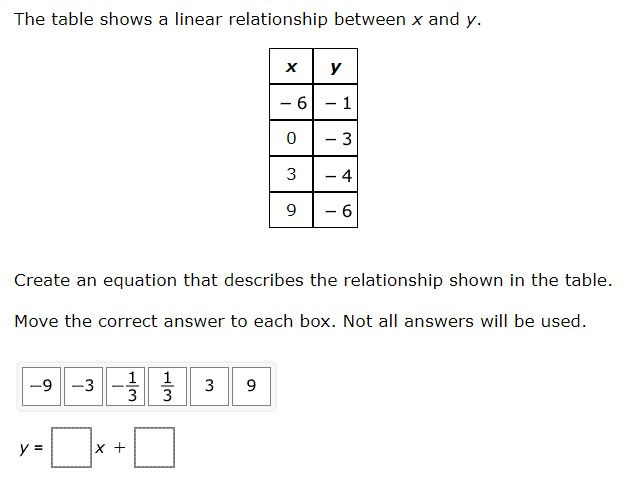
Analysis
Slope-intercept form had to be interpreted from a problem situation
Slope had to be calculated from pairs of coordinates
Y-intercept had to be recognized from ordered pair where x=0 and used as b
Equation for slope not on reference materials
Instructional Implications
Practice converting problem situations into slope-intercept form and using the equation to calculate a table of values
Ensure students know that you can find y-intercept if given an ordered pair with an x-value of 0
Practice finding slope with m = (y2 - y1)/(x2 - x1)
Watch the full walkthrough of all 38 items on the 2023 7th Grade STAAR below.
7.9C - 34% overall mastery
determine the area of composite figures containing combinations of rectangles, squares, parallelograms, trapezoids, triangles, semicircles, and quarter circles
#13 - 32% correct
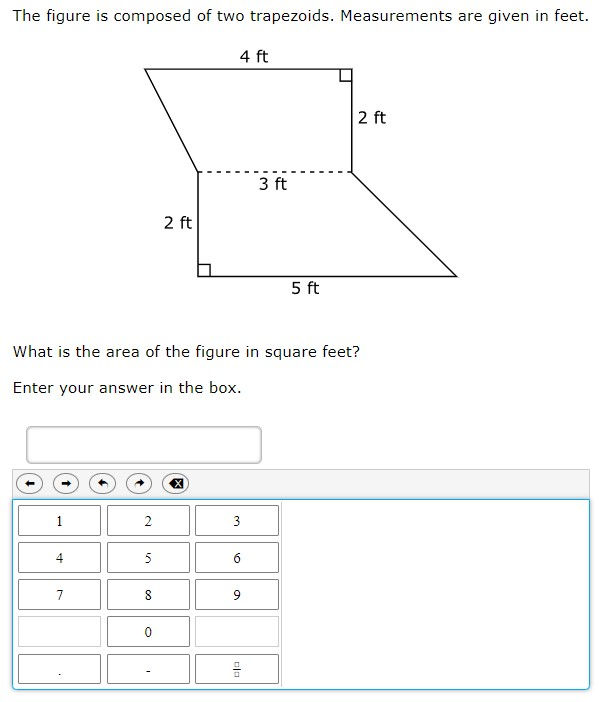
#26 - 38% correct

Analysis
Area of a trapezoid formula more complex than rectangle or triangle
Equation editor provided no confirmation of solution (e.g., from multiple choice)
Many calculations required for finding area of dark wood
Answer distribution on #26 suggests guessing
Instructional Implications
Provide many opportunities for finding area of various composite shapes
Given figure with shaded/unshaded regions, have students set up equations to find the area of both
Given figure with shaded/unshaded regions, have students find the area of both
7.6I - 36% overall mastery
determine experimental and theoretical probabilities related to simple and compound events using data and sample spaces
#16 - 46% correct
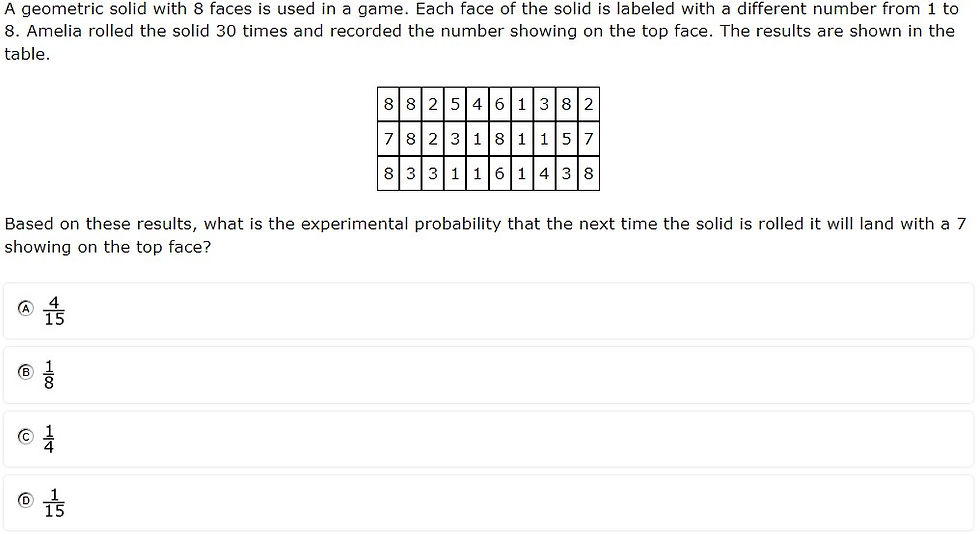
#30 - 26% correct
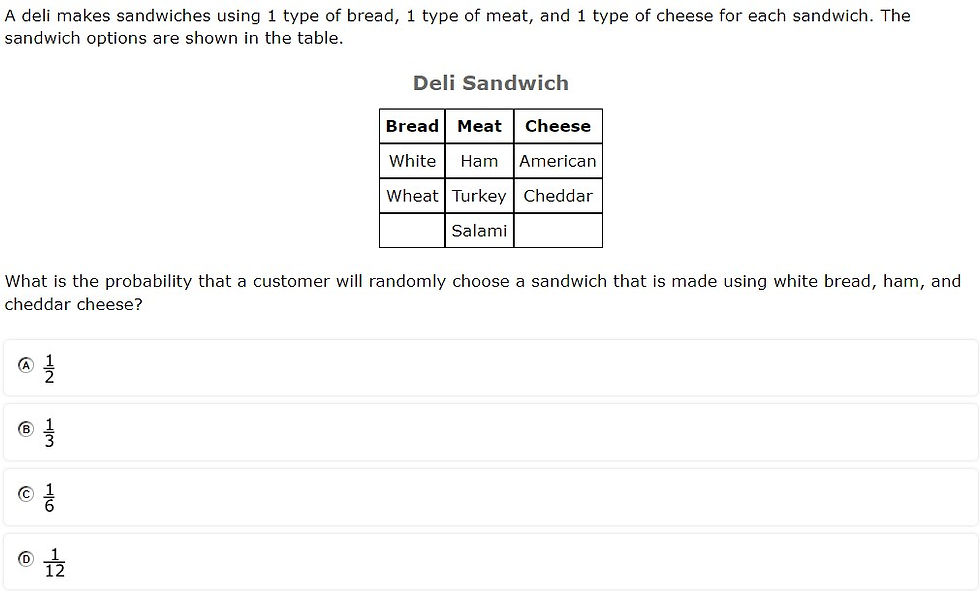
Analysis
Students had to find experimental probability but theoretical probability was one of the answer choices (chosen by 24%)
Compound probability confused many students, with the most chosen answer (37%) being the number of choices available (3), a solution that required no calculations
Instructional Implications
Provide students with experimental data and have students find both the experimental and theoretical probabilities (and discuss the differences)
Have students solve compound probabilities both with a tree diagram and mathematical calculation
7.4A - 51.5% overall mastery
represent constant rates of change in mathematical and real-world problems given pictorial, tabular, verbal, numeric, graphical, and algebraic representations, including d = rt
#9 - 38% correct
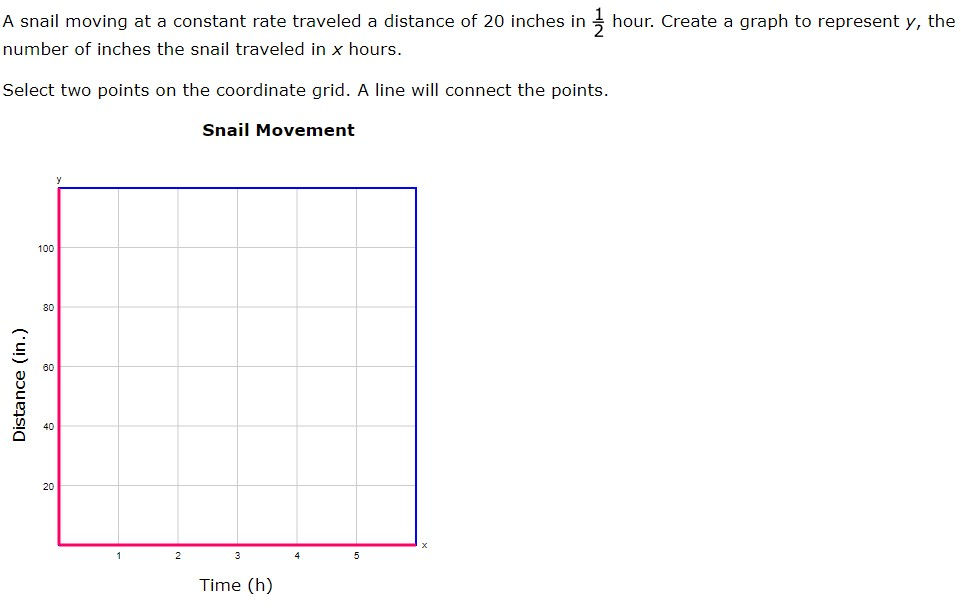
#23 - 43% full credit, 43% partial credit, 13% no credit
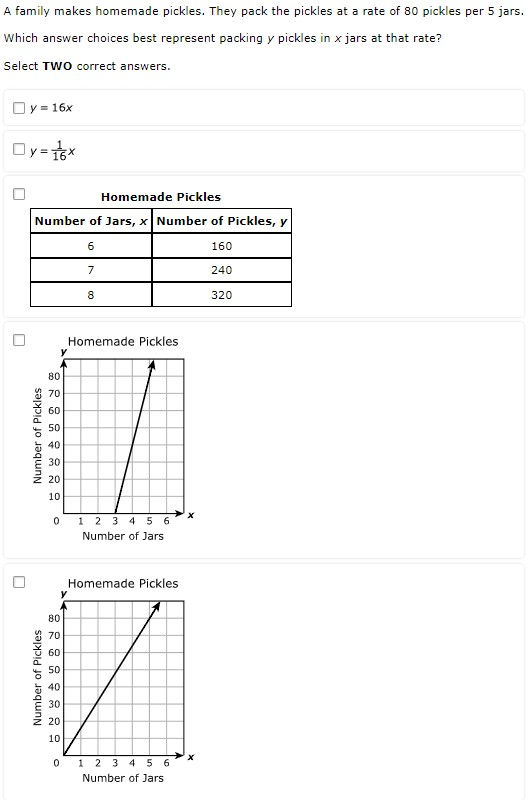
Analysis
The graphing online tool is not 100% intuitive
Not visually clear that students can choose ½ as an x-coordinate
Multiple select allows for greater confidence while guessing
Instructional Implications
Provide students with coordinate grids and have them plot constant rates, providing multiple points and using various scale factors
Give students constant rate in a problem situation and have them calculate in direct variation form (y=kx), create a table, and graph the equation
7.12A - 53% overall mastery
compare two groups of numeric data using comparative dot plots or box plots by comparing their shapes, centers, and spreads
#10 - 43% correct
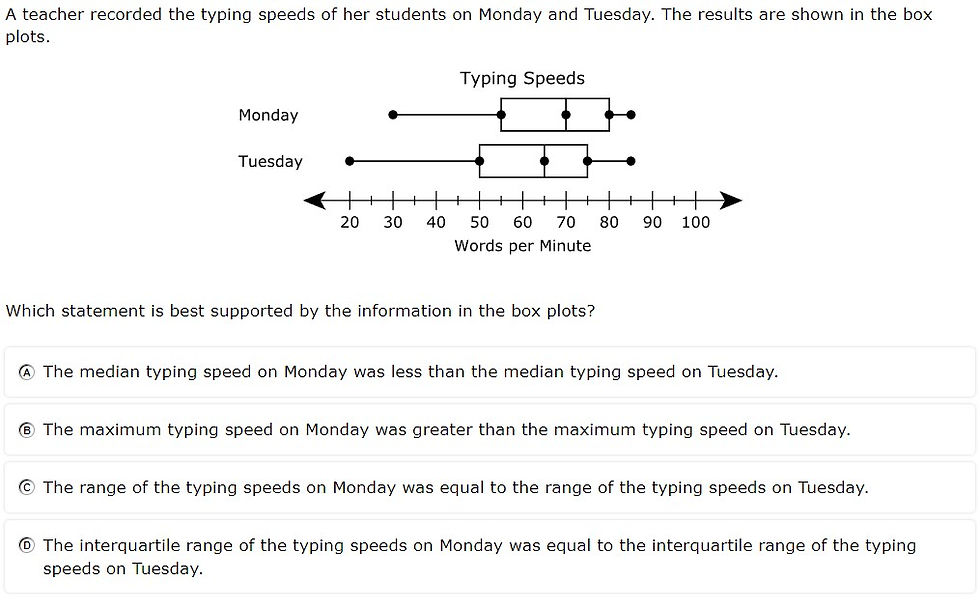
#32 - 42% full credit, 17% partial credit, 42% no credit
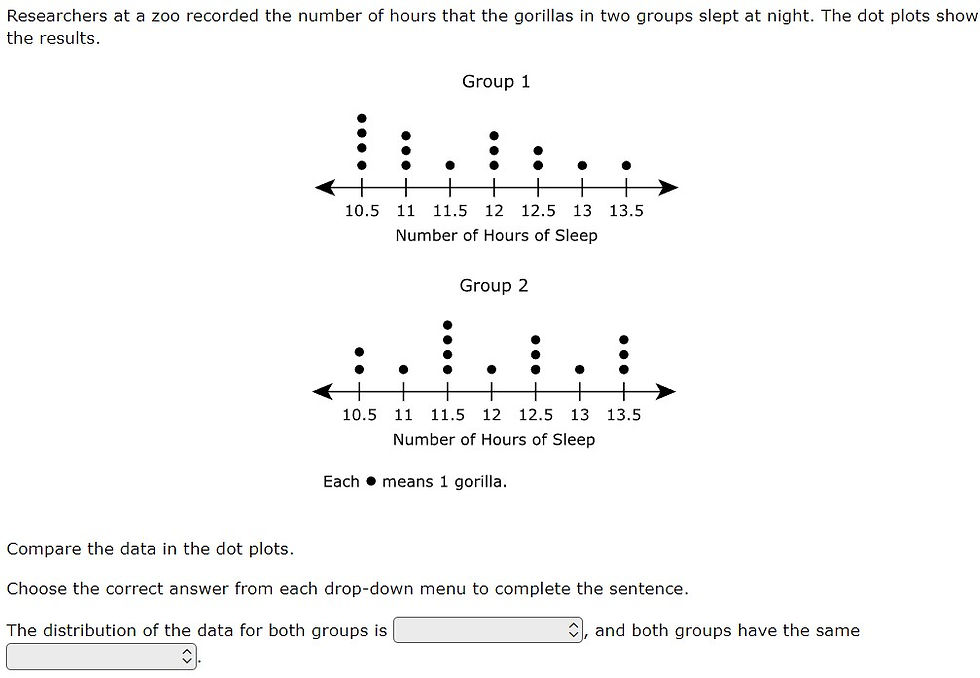
Analysis
Students had to apply various concepts using domain-specific vocabulary terms (e.g., median, range, interquartile range)
Evaluating statements and finding the one that supports the graph requires up to 4X the calculations
Interpreting box plots assumes understanding of quartiles
Instructional Implications
In addition to calculating range, IQR, etc., have students find range of individual quartiles (e.g., What’s the range of the 2nd quartile?)
Median should be calculated on box plots, dot plots, and with raw data (sorted and unsorted)
7.11A - 42.5% overall mastery
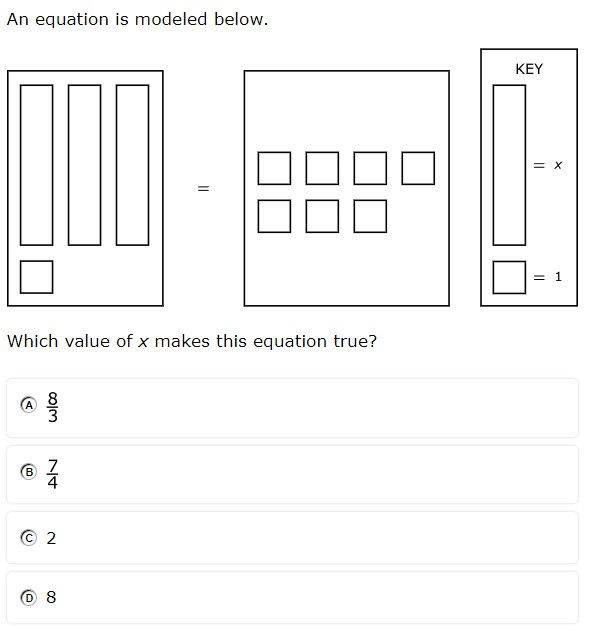
model and solve one-variable, two-step equations and inequalities
#18 - 38% correct
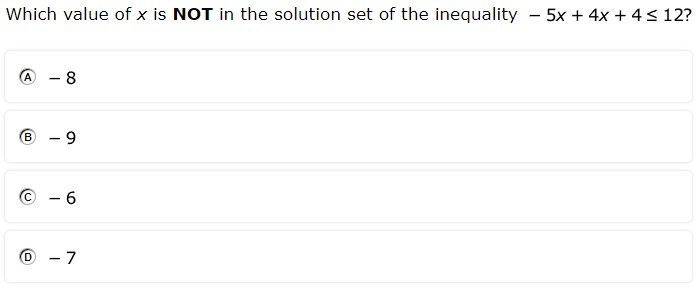
#38 - 47% correct
Analysis
Students had to invert the inequality due to dividing by a negative
Like terms had to be simplified in addition to using properties of equality
Equation was modeled using algebra tiles rather than being written
Instructional Implications
Provide problems that require students to combine like terms before isolating the variable
Encourage students to check work with substitution
Give students an equation or problem situation and have them translate that into a representation using algebra tiles
unsorted)
7.4D - 44% overall mastery
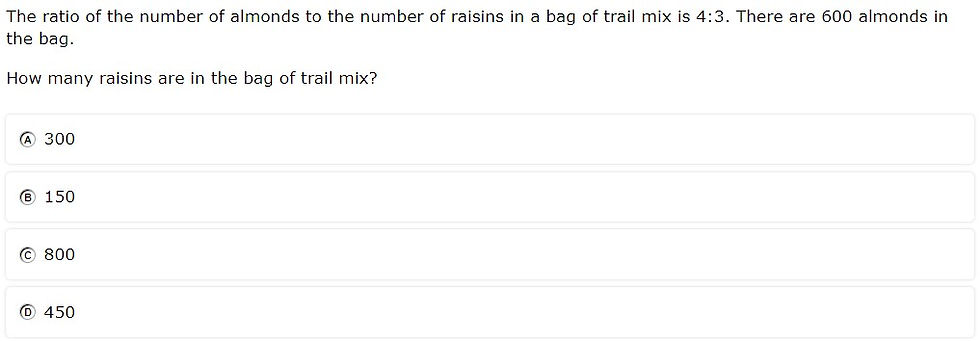
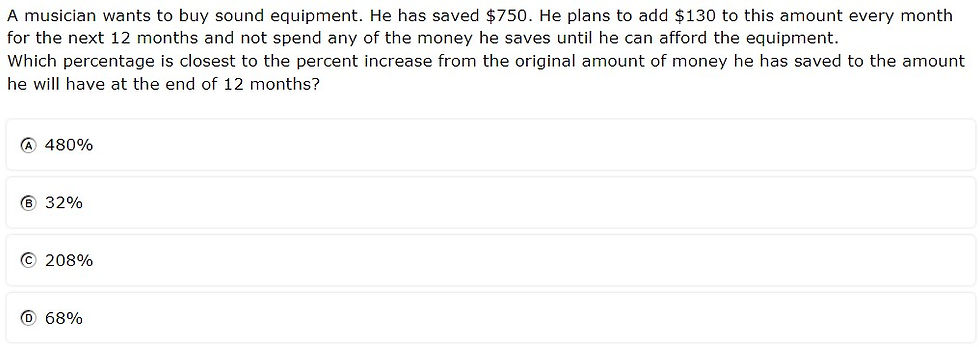
solve problems involving ratios, rates, and percents, including multi-step problems involving percent increase and percent decrease, and financial literacy problems
#1 - 50% correct
#21 - 38% correct
Analysis
Students had use a ratio to solve a problem situation
Calculating percent increase requires a specific ratio that is not provided on the reference materials
The percent increase problem required a calculation before finding the ratio
Instructional Implications
Have students use a ratio to find both items in a problem situation (e.g., find the number of almonds AND raisins)
Extra practice with percent increase and decrease problems
Provide opportunities to talk through reasonableness in percent increase or decrease problems (e.g., $1,560 is a little more than twice $750)
unsorted)
7.9B - 45.5% overall mastery
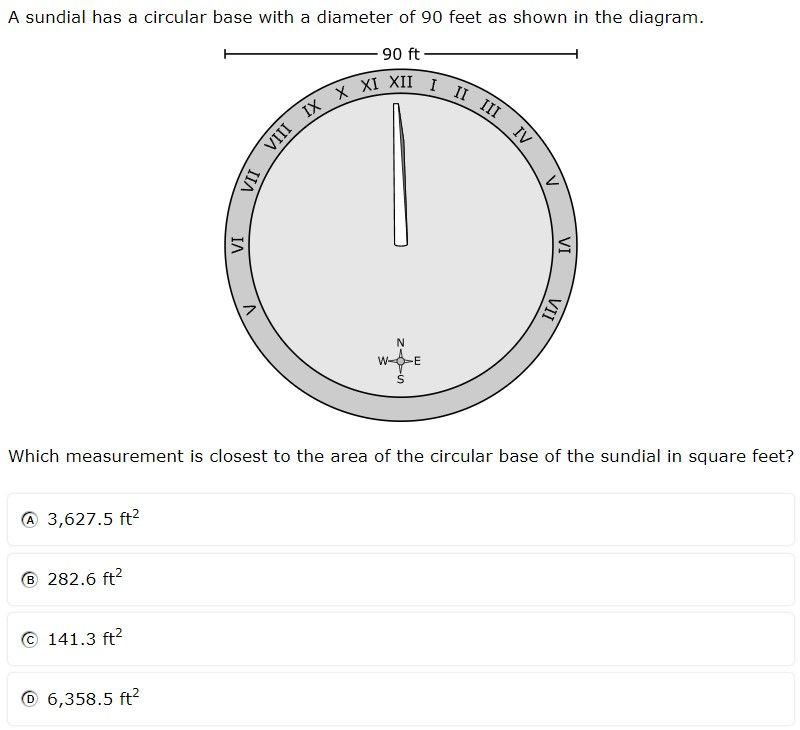
determine the circumference and area of circles
#8 - 34% correct
#37 - 57% correct

Analysis
Students more often chose the circumference (B) than the area (D) because the diameter was given rather than the radius
When given the radius, students had to choose the correct formula (C = 2πr rather than C = πd)
Multiplying a decimal without technology (3.14) offers challenges
Instructional Implications
Give students a circle and have them calculate both area and circumference, noting the relationship with the two
Have students practice estimating the circumference by tripling the diameter or multiplying the radius by 6
unsorted)
7.3B - 47.5% overall mastery
apply and extend previous understandings of operations to solve problems using addition, subtraction, multiplication, and division of rational numbers
#14 - 44% correct
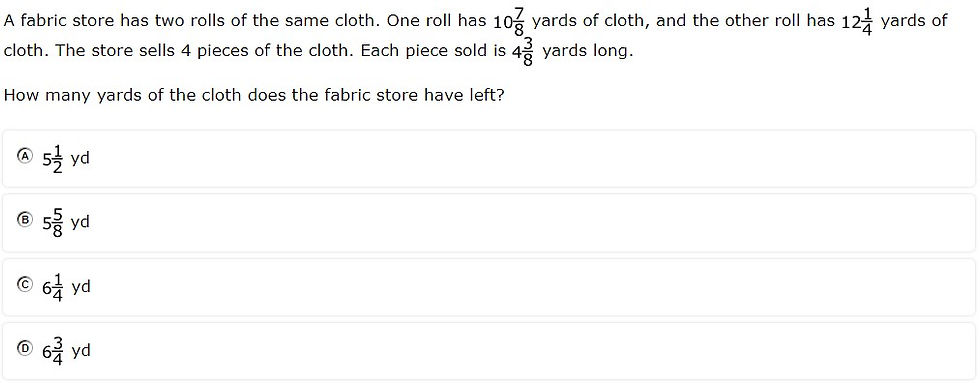
#31 - 51% correct
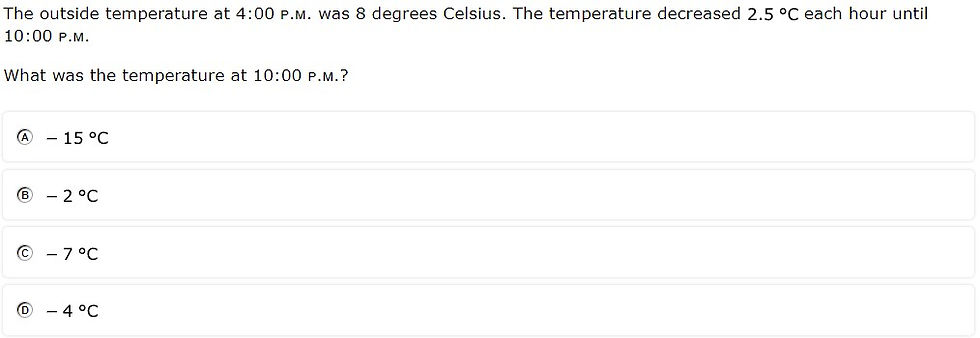
Analysis
The addition, subtraction, and multiplication of mixed numbers involved regrouping an improper fraction
Hidden number (i.e., the number of hours between 4:00 and 10:00) made the problem more complex
Instructional Implications
Reinforce mixed number concepts with concrete and pictorial representations
Provide ample opportunities for students to add, subtract, and multiply mixed numbers, regrouping the fraction as needed
Have students practice operational problems that involve time intervals to simulate the hidden number
7.9A - 49% overall mastery
solve problems involving the volume of rectangular prisms, triangular prisms, rectangular pyramids, and triangular pyramids
#17 - 39% correct
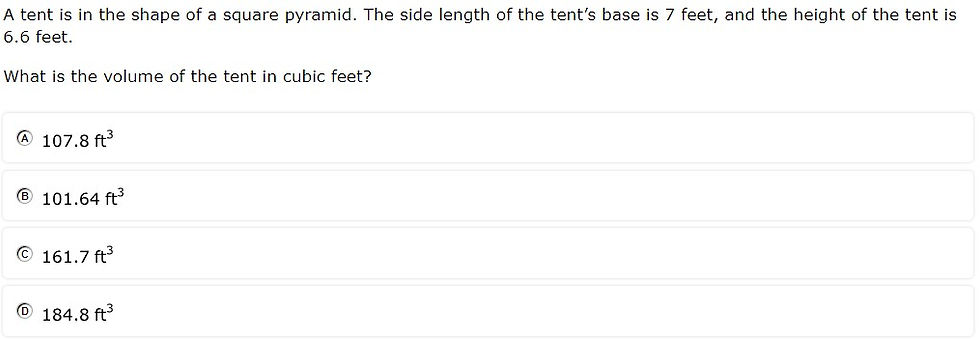
#34 - 59% correct
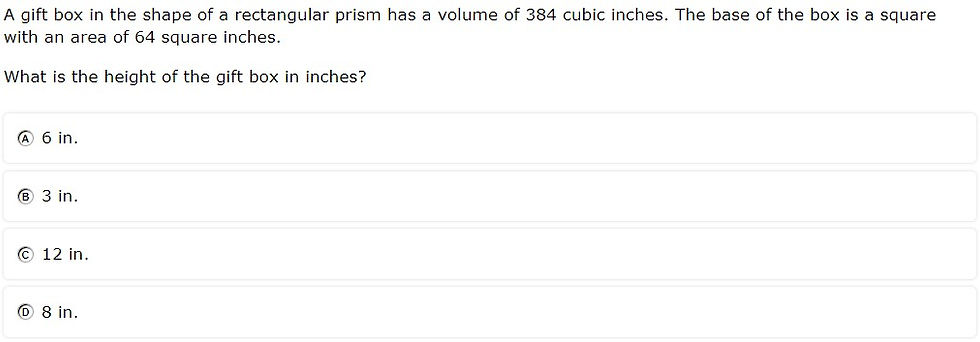
Analysis
Students were given the side length of the base rather than the area of the base
Rather than solving for volume, students were given volume and solved for height
Instructional Implications
Practice solving for pyramids with a variety of bases (e.g., square, triangle, rectangle), providing only height and side lengths
Have students solve for multiple dimensions (e.g., base, height, side length) in addition to solving for volume


Comments