
A.6A Activities
- Aaron Daffern
- Feb 19, 2024
- 5 min read

This post explores some ideas for reviewing concepts for TEKS A.6A.
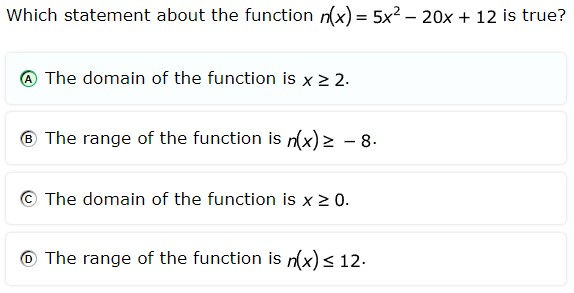
determine the domain and range of quadratic functions and represent the domain and range using inequalities
Staar Performance
On recent STAAR tests, here is how students across the state of Texas have performed.
2023 #11 - 47% correct
2023 #32 - 44% correct
Active, Playful Learning
The activities shared in this post are designed to follow the six principles of Active, Playful Learning:
Active
Engaging
Meaningful
Social
Iterative
Joyful
These six principles, together with a clear learning goal, help students learn.
Students learn through active, engaged, meaningful, socially interactive, iterative and joyful experiences in the classroom and out. When we add a learning goal or engage in guided play we achieve Active Playful Learning.
In other words, math review doesn't have to be boring STAAR prep or mindless worksheets. Instead, students' learning is enhanced when playing with numeracy and algebraic concepts in a guided context. Who says math can't be fun? You can watch a video to learn more about Active, Playful learning here.
Activities
Here's a walkthrough of all the activities on this blog post.
Talk a Mile a Minute
Learning objective: Students will name terms associated with key ideas related to the domain and range of quadratic functions.
Pair students together.
Display a term related to TEKS A.6A on the board (e.g., domain, range, x-axis, y-axis, x-value, y-value, axis of symmetry).
Partner A has one minute to name as many phrases related to the shown term while partner B writes them down.
Show another term for one minute while partner B names related terms and partner A writes them down.
Give partners 3 minutes to circle, from each list, one term they think will be on someone else's list and one term they think will not be on anyone else's list.
As a class, go over the circled terms from each list. Pairs earn one point for each term they correctly guess will or will not be on another list (4 points max).
Have students provide a rationale for obscure terms and let the class decide whether or not they relate to the given term.

Variations
Provide a list of closely related terms to ban for each target word, forcing students to cast a wider net for points.
Create a list of bonus words that earn an extra point if they appear on students' lists, regardless of whether or not they are selected as a circled term.
Have pairs work on different words simultaneously, rotating several turns until every pair as gone through every term before the class debrief. This will forestall pairs from picking up words from their neighbors.
Allow pairs to select two words that will be on other's lists to reinforce common terms related to target vocabulary.
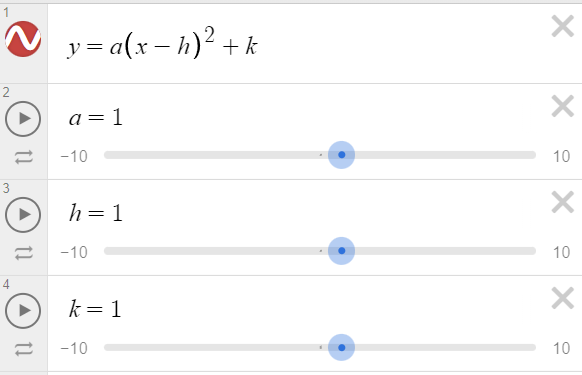
Quadratic Sliders
Learning objective: Students will use an online graphing tool to manipulate the vertex of a quadratic equation.
On their laptops/Chromebooks, have students open Desmos.
Ask students to enter the quadratic vertex form (y = a(x - h)^2 + k) and add sliders for the values a, h, and k.
Give students a series of clues so that their graph can match the clues by further adjusting the values h or k. For example, move the sliders so that the vertex is in quadrant III.
Have students change the a value as well to match the clues. For example, make the function open downward and be very wide [or narrow].
For each manipulation, have students share their changes and discuss commonalities as a class.
Variations
Have students restrict the domain and/or range using curly braces (e.g., {x >= l}{y <= r}) and add l and r as sliders for further manipulation.
Allow students to lead the activity, giving directions and/or restrictions to the class and then checking for correctness.
Have students transfer the values in the sliders to an equation (written in vertex form) that represents the function they've graphed on Desmos.
Show a graphed function on Desmos and hide the sliders. Allow students to work together to approximate the values of a, h, k, l, and r based on the graph before revealing them.
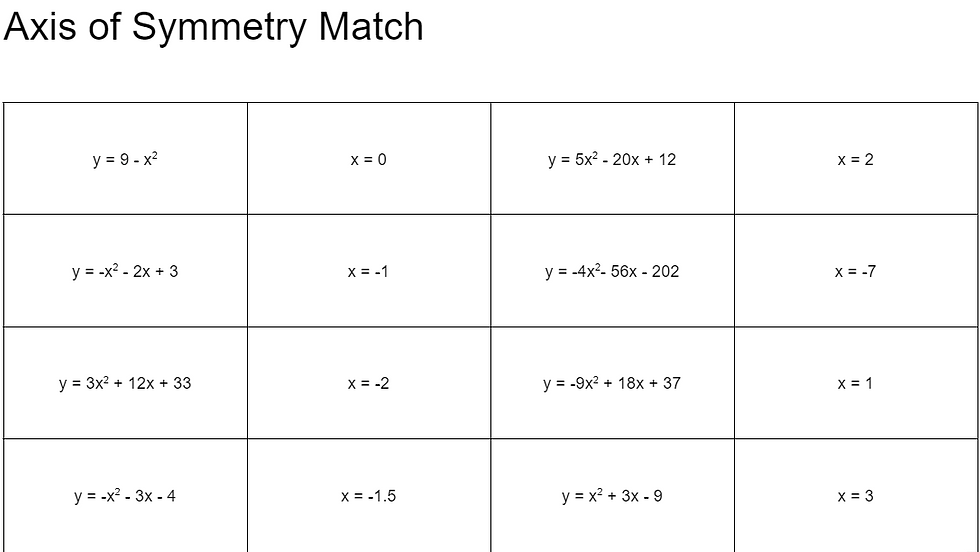
Axis of Symmetry Match
Learning objective: Students will find the axis of symmetry of a quadratic function given the standard form.
Note: Students can find the vertex of a quadratic function when they identify the axis of symmetry given standard form and substitute the x-value into the equation to find the y-value.
Pair students up and give them the axis of symmetry match cards.
Without calculator, pencil, or paper, have students match the standard forms with their corresponding axes of symmetry.
Allow pairs to check their work with another pair.
Variations
Allow students to use pencil/paper or calculator to check their work.
After matching all the cards, ask students to take two pairs and find the vertex for each of them by substituting the x-value into the equation to find the y-value. When this is complete, students should note the sign for a and write the range.
Allow students to use the cards individually or with pairs as a memory match game.
Ask students to graph the functions on a graphing calculator to check to see if they correctly identified the axis of symmetry.
Race to the Inequality
Learning objective: Students work collaboratively to describe the range of a quadratic equation with inequalities.
Ask for (or designate) 13 volunteers. The first 9 volunteers will each represent the digits 1 - 9 (either printed up or written on white boards). The remaining four volunteers will represent y, a negative sign (i.e., - ), and the inequality symbols ≥ and ≤.
Split the rest of the class into two teams.
Display the graph of a quadratic equation on the board or interactive white board. The 13 volunteers should each be facing the class with their backs to the board.
The first team's task is to represent the range. As quickly as they can, the team directs the 13 volunteers (not all will be used) to arrange themselves to represent the range.
Reset the volunteers. The second team works on a different quadratic equation, trying to beat the time of the first team.

Variations
Instead of displaying the graph of a quadratic equation, display the equation in vertex form [y = a(x - h)^2 + k].
For alternate scoring, give teams points based on whether or not they solve within stepped time frames. For example, 5 points for solving in 20 seconds or less, 4 points for solving in 30 seconds or less, etc.
For an extra challenge, have a team arrange the volunteers to represent both the domain and range in succession under a predetermined time limit. Be sure to add volunteers that represent positive and negative infinity.
Use range limitations that require two digits (e.g., 21). Add an extra volunteer to represent zero and ensure that a digit is not used more than once.
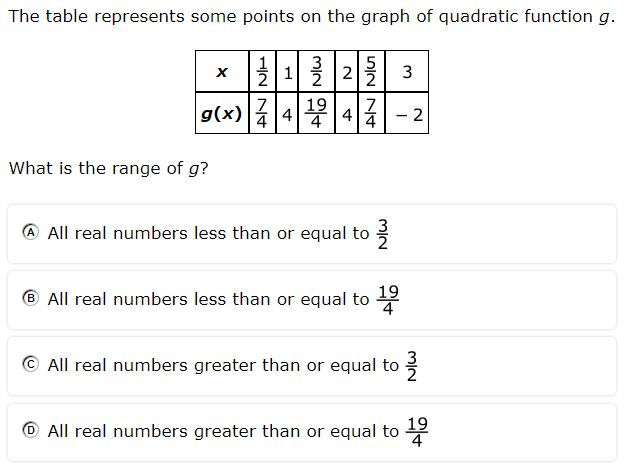
Table Range
Learning objective: Students will identify the range of a quadratic function given a table of values.
Materials: Give each team two half-sheets of paper, one printed with y ≥ and the other printed with y ≤.
Split class into teams of four.
Display a table of values for a quadratic function (e.g., 2023 STAAR #32)
Give teams a small time limit (e.g., 20 seconds) to converse with each other and identify the range.
When time is up, each team sends a representative up to the board/screen and places either y ≥ or y ≤ on the dependent variable value that represents the limit of the range.
Ask students how they knew that the value they chose was the limit of the range.

Variations
Replace the half-sheets with y ≥ and y ≤ with half-sheets that read all real numbers greater than or equal to and all real numbers less than or equal to.
Have a coordinate grid on the board. After identifying the range, ask another team to come up, plot the points, and sketch a graph.
Use a mixture of decimals, mixed numbers, and improper fractions for the dependent variable values in the tables.
Change up the directionality of the tables. Have some read horizontally and some read vertically.


Comments