
Strip Diagram: Comparison [TEKS Tools Grade 4]
- Aaron Daffern
- Jan 10
- 2 min read

This post specifically looks at how comparison strip diagrams can be used to solve a variety of problems. Read more about TEKS Tools and their rationale here.
Strip Diagram
Strip diagrams, the first TEKS Tool, account for around 25% of each 4th grade STAAR test. Within this tool are many variations: part-whole, equal groups, and comparison (the first two being the primary types of strip diagram used).
The main function of a strip diagram is to show the relationship between the quantities in the problem situation. When the relationship is evident, students can select the correct operations and perform accurate calculations.
One thing to note about strip diagrams is that the total can be shown in a variety of ways and positions. I vary how I represent the total to match the various representations seen on STAAR.
COMPARISON
Comparative relationships are used to solve problems involving all four operations. This type of strip diagram is need much less often than part-whole and equal groups strip diagrams.
4.4A - add and subtract whole numbers and decimals to the hundredths place using the standard algorithm
Click on each > to expand
2023-14: one group and a comparison were given, students had use the comparison to find the other group

2025-18: two quantities were given, students had to compare

4.4A Practice Set
4.5A - represent multi-step problems involving the four operations with whole numbers using strip diagrams and equations with a letter standing for the unknown quantity
Click on each > to expand
2024-23: a part and a total (in two parts) were given, students had to compare

4.5A Practice Set
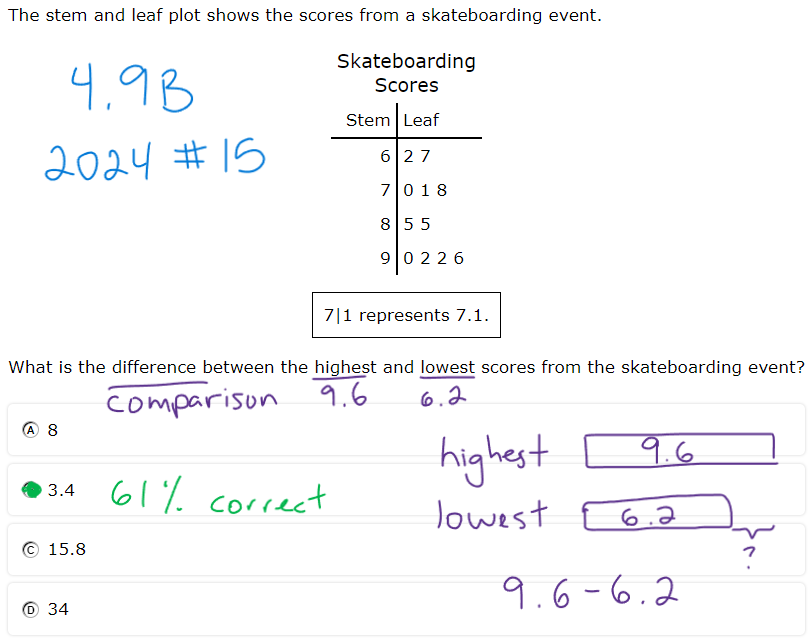
4.9B - solve one- and two-step problems using data in whole number, decimal, and fraction form in a frequency table, dot plot, or stem-and-leaf plot
Click on each > to expand
2024-15: two groups were given, students had to compare
4.9B Practice Set
Comments