7.4
Proportionality. The student applies mathematical process standards to represent and solve problems involving proportional relationships. The student is expected to:
(A) represent constant rates of change in mathematical and real-world problems given pictorial, tabular, verbal, numeric, graphical, and algebraic representations, including d = rt;
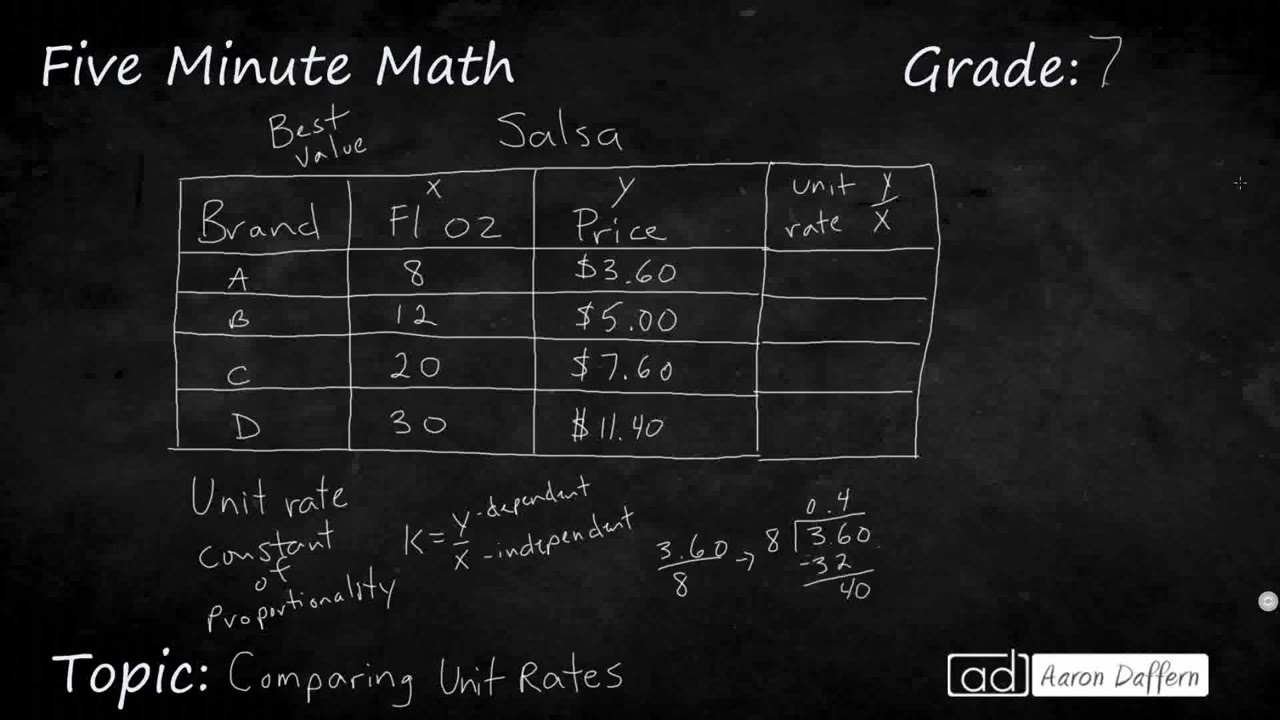
(B) calculate unit rates from rates in mathematical and real-world problems;
(C) determine the constant of proportionality (k = y/x) within mathematical and real-world problems;
(D) solve problems involving ratios, rates, and percents, including multi-step problems involving percent increase and percent decrease, and financial literacy problems; and
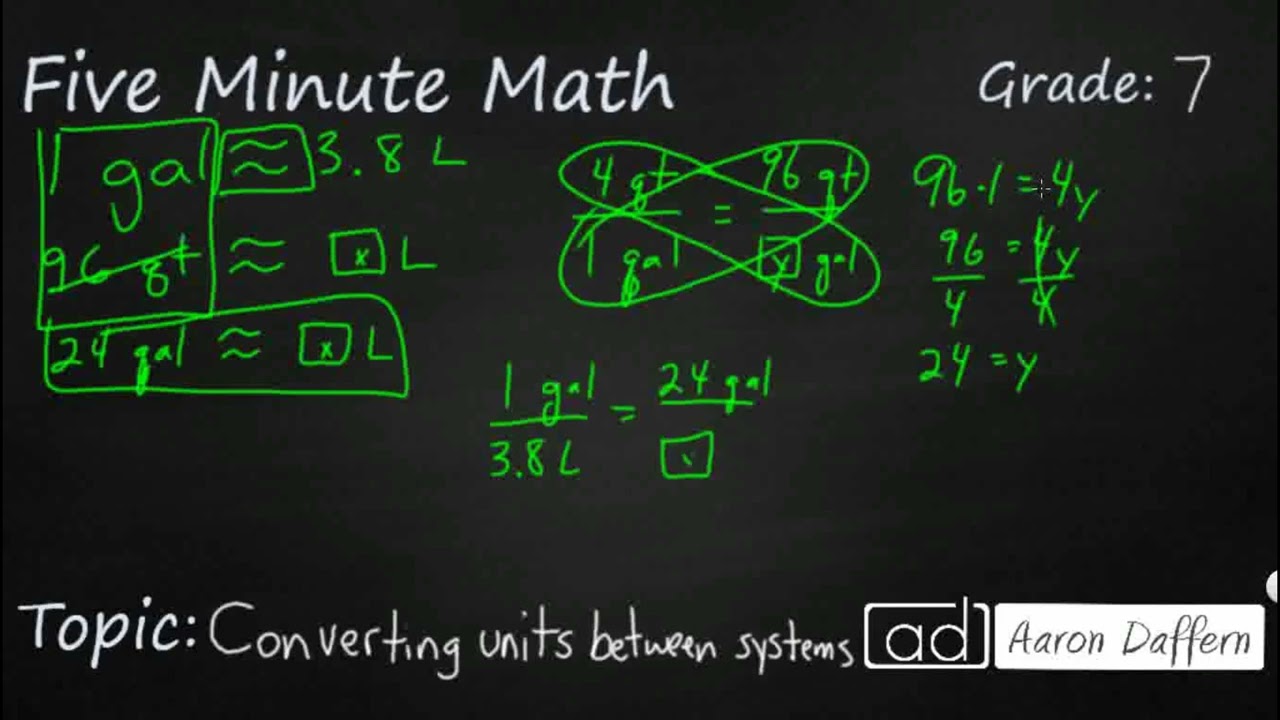
(E) convert between measurement systems, including the use of proportions and the use of unit rates
7.5
Proportionality. The student applies mathematical process standards to use geometry to describe or solve problems involving proportional relationships. The student is expected to:
(A) generalize the critical attributes of similarity, including ratios within and between similar shapes;
(B) describe π as the ratio of the circumference of a circle to its diameter; and
(C) solve mathematical and real-world problems involving similar shape and scale drawings.
7.6
Proportionality. The student applies mathematical process standards to use probability and statistics to describe or solve problems involving proportional relationships. The student is expected to:
(A) represent sample spaces for simple and compound events using lists and tree diagrams;
(B) select and use different simulations to represent simple and compound events with and without technology;
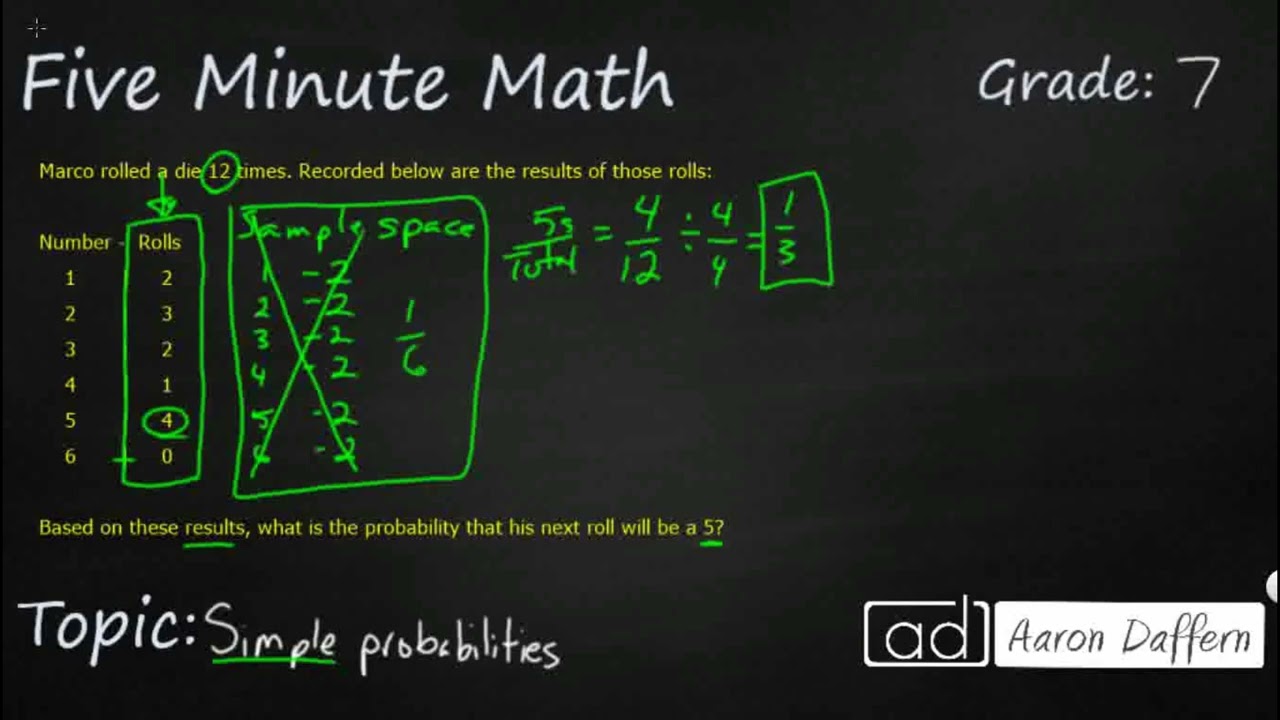
(C) make predictions and determine solutions using experimental data for simple and compound events;
(D) make predictions and determine solutions using theoretical probability for simple and compound events;
(E) find the probabilities of a simple event and its complement and describe the relationship between the two;
(F) use data from a random sample to make inferences about a population;
(G) solve problems using data represented in bar graphs, dot plots, and circle graphs, including part-to-whole and part-to-part comparisons and equivalents;
(H) solve problems using qualitative and quantitative predictions and comparisons from simple experiments; and
(I) determine experimental and theoretical probabilities related to simple and compound events using data and sample spaces.