top of page


5.9
Data analysis. The student applies mathematical process standards to solve problems by collecting, organizing, displaying, and interpreting data. The student is expected to:
(A) represent categorical data with bar graphs or frequency tables and numerical data, including data sets of measurements in fractions or decimals, with dot plots or stem-and-leaf plots;
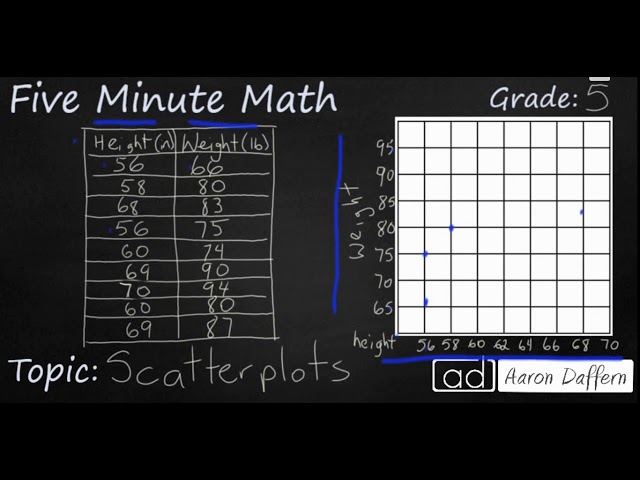
(B) represent discrete paired data on a scatterplot; and
(C) solve one- and two-step problems using data from a frequency table, dot plot, bar graph, stem-and-leaf plot, or scatterplot.


bottom of page