top of page


2.10
Data analysis. The student applies mathematical process standards to organize data to make it useful for interpreting information and solving problems. The student is expected to:
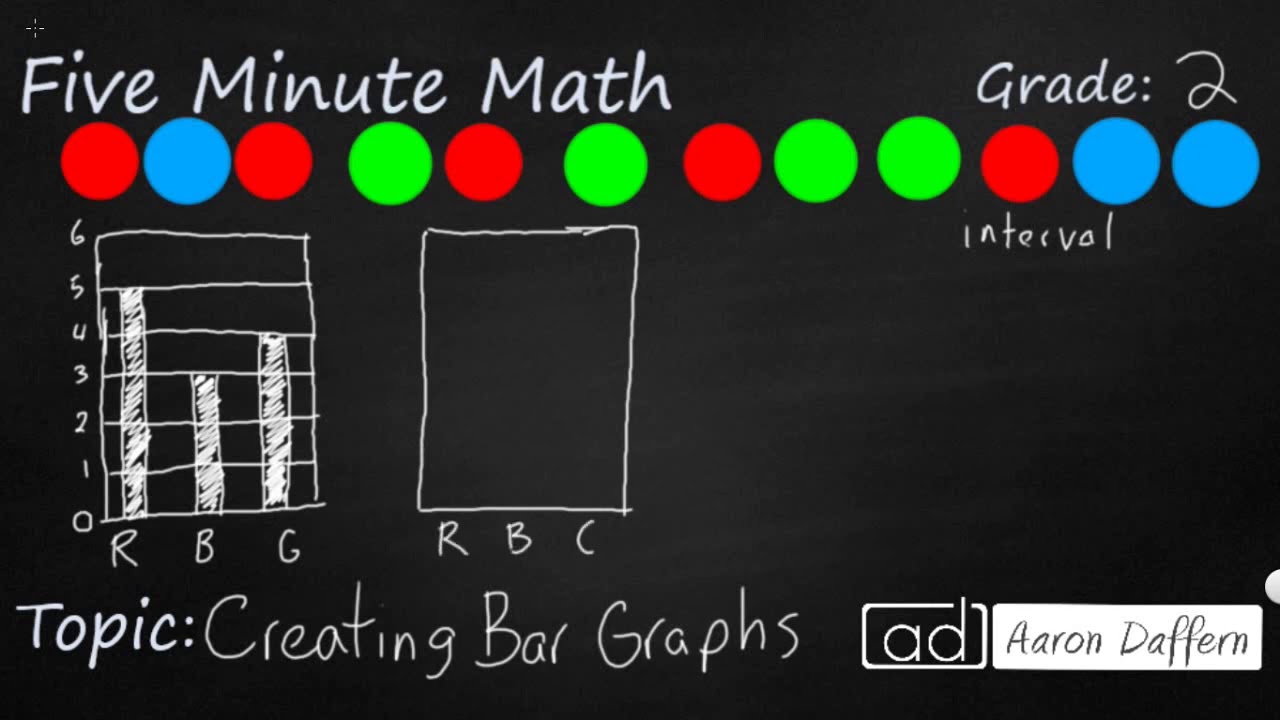
(A) explain that the length of a bar in a bar graph or the number of pictures in a pictograph represents the number of data points for a given category;
(B) organize a collection of data with up to four categories using pictographs and bar graphs with intervals of one or more;
(C) write and solve one-step word problems involving addition or subtraction using data represented within pictographs and bar graphs with intervals of one; and
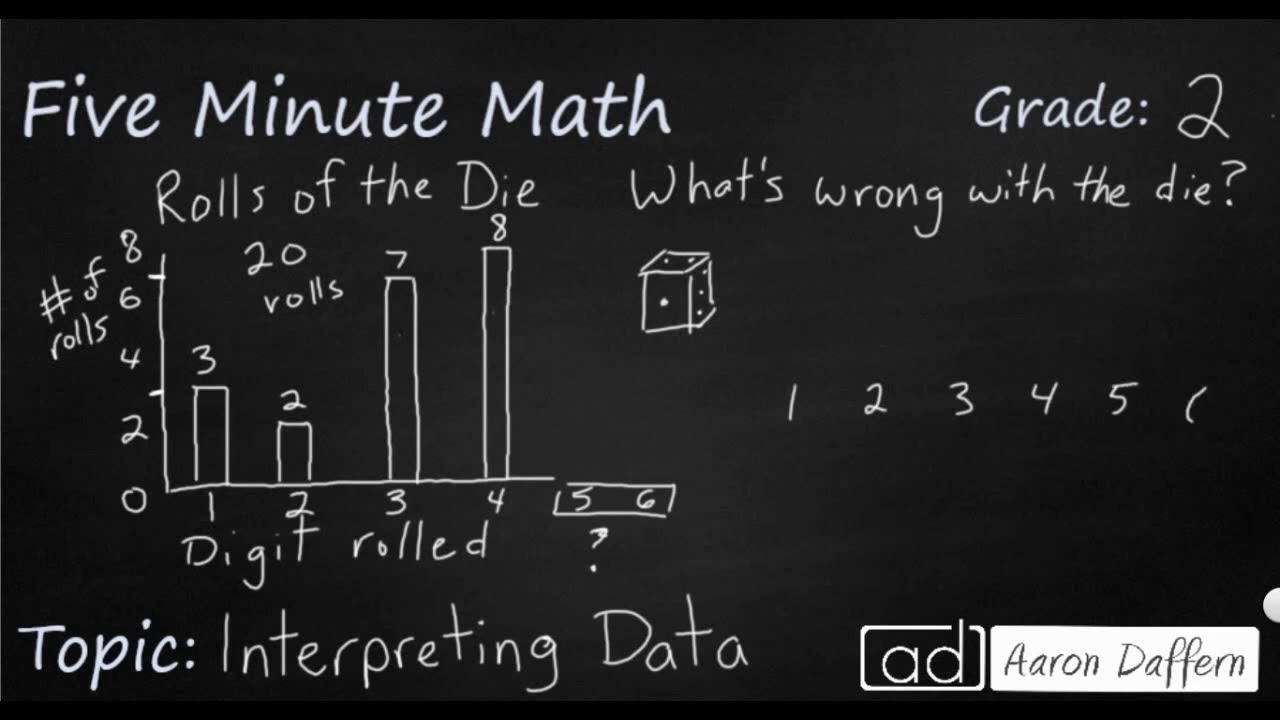
(D) draw conclusions and make predictions from information in a graph.


bottom of page