
Number Lines: Rates [TEKS Tools Grade 7]
- Aaron Daffern
- Mar 17
- 2 min read

This post specifically looks at how number lines can be used solve problems involving rates. Read more about TEKS Tools and their rationale here.
Number Lines
Number lines account for around 30% of each 7th grade STAAR test. These number lines are applied to solve problems related to ratios, rates, percents, scale, and operations.
The main function of a number line is to solve problems involving operations, understand ratios, rates, and proportionality, or as a tool to explore scale and percent increase/decrease. By visualizing these quantities on number lines, students can better make sense of the how the quantities are related.
Constant Rates
7.4A - represent constant rates of change in mathematical and real-world problems given pictorial, tabular, verbal, numeric, graphical, and algebraic representations, including d = rt
Click on each > to expand
2023-9: a rate is given, students have to represent it on a graph

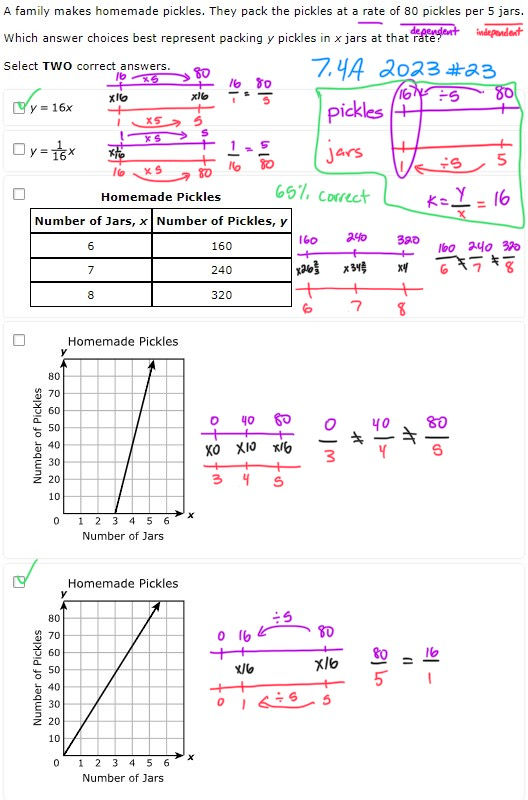
2023-23: a rate is given, students have to represent it on a graph and with an equation
2024-16: a rate is given, students have to represent it on a graph

2024-26: a rate is given, students have to represent it on a graph

2025-4: a rate is given, students have to represent it in a table

2025-31: a rate is given, students have to represent it with an equation

Unit rates
7.4B - calculate unit rates from rates in mathematical and real-world problems
Click on each > to expand
2023-36: a real-world situation was given, students had to calculate the unit rate

2024-26: a real-world situation was given, students had to calculate the unit rates

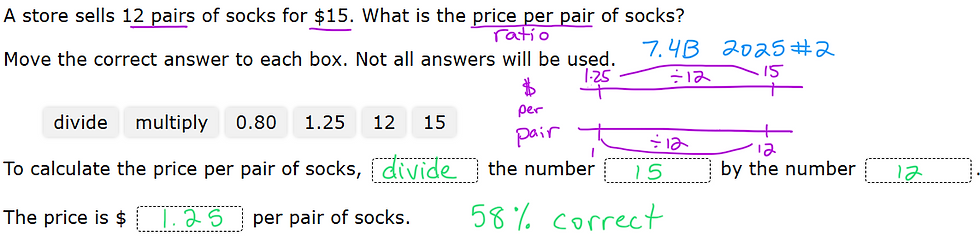
2025-2: a real-world situation was given, students had to calculate the unit rate and describe how to find it
Comments