
Lessons learned from the 2025 Algebra I STAAR EOC
- Aaron Daffern
- Jan 15
- 6 min read

Using a modified version of the statewide item analysis report, I examined the readiness standards that had less than 60% mastery. Each standard has both an analysis of the items themselves to infer what made them so difficult and instructional implications for educators to ensure a more successful 2026 STAAR test.
Standard | # of items | % mastery |
A.11B | 2 | 35.5 |
A.3D | 2 | 38.5 |
A.5C | 2 | 42 |
A.7C | 2 | 45.5 |
A.2I | 2 | 50 |
A.5A | 2 | 50 |
A.6A | 2 | 51 |
A.2A | 2 | 53 |
A.9C | 2 | 53 |
A.8A | 2 | 55.5 |
A.3B | 2 | 56 |
A.9D | 2 | 56.5 |
A.10E | 2 | 57.5 |
Access the slide deck here.
A.11B - 35.5% overall mastery
simplify numeric and algebraic expressions using the laws of exponents, including integral and rational exponents
#28 - 24% full credit; 31% partial credit; 45% no credit

#48 - 31% correct

Analysis
The negative exponent in the denominator of #28 increases the complexity
Students could have solved using negative exponents and product of powers or simply the quotient of powers
For #48, 33% chose B (either added exponents 3+2) or forgot the extra y
Students had to apply three rules (negative exponents, power of a power, multiplication of powers) to solve
Both problems included negative exponents
Instructional Implications
Show how the expressions could be simplified using more than one sequence (if applicable)
A.3D - 38.5% overall mastery
graph the solution set of linear inequalities in two variables on the coordinate plane
#10 - 49% correct

#30 - 24% full credit; 8% partial credit; 67% no credit

Analysis
Instructional Implications
Have students test the origin (0, 0) to evaluate whether or not it’s in the solution set
Practice using the graphing tool on CambiumGive students range and direction of graph and have them sketch a graph
Watch the full walkthrough of all 50 items on the 2025 Algebra I STAAR EOC below.
A.5c - 42% overall mastery
solve systems of two linear equations with two variables for mathematical and real-world problems
#11 - 52% correct

#24 - 32% correct

Analysis
Both problems were set up for students to easily use substitution
#24 asked students to describe the solution rather than to find the solution
35% chose B, most likely finding one correct solution but not considering more than one solution
Instructional Implications
Students should be familiar with the meaning of non-traditional statements when using substitution or elimination (e.g., 24 = 24)
Before relying on one strategy (e.g., graphing), students should consider all strategies to find the most efficient
A.7C - 45.5% overall mastery
determine the effects on the graph of the parent function f(x) = x^2 when f(x) is replaced by af(x), f(x) + d, f(x - c), f(bx) for specific values of a, b, c, and d
#12 - 41% correct

#39 - 36% full credit; 27% partial credit; 37% no credit

Analysis
Instructional Implications
Horizontal movement is not intuitive f(x) = a(x - h)^2 + k
Graphing both f(x) and g(x) would show both shifts
The format of the vertex form [f(x) = a(x-h)^2 + k] will be used in many other functions to explain transformations
A.2I - 50% overall mastery
write systems of two linear equations given a table of values, a graph, and a verbal description
#4 - 66% correct
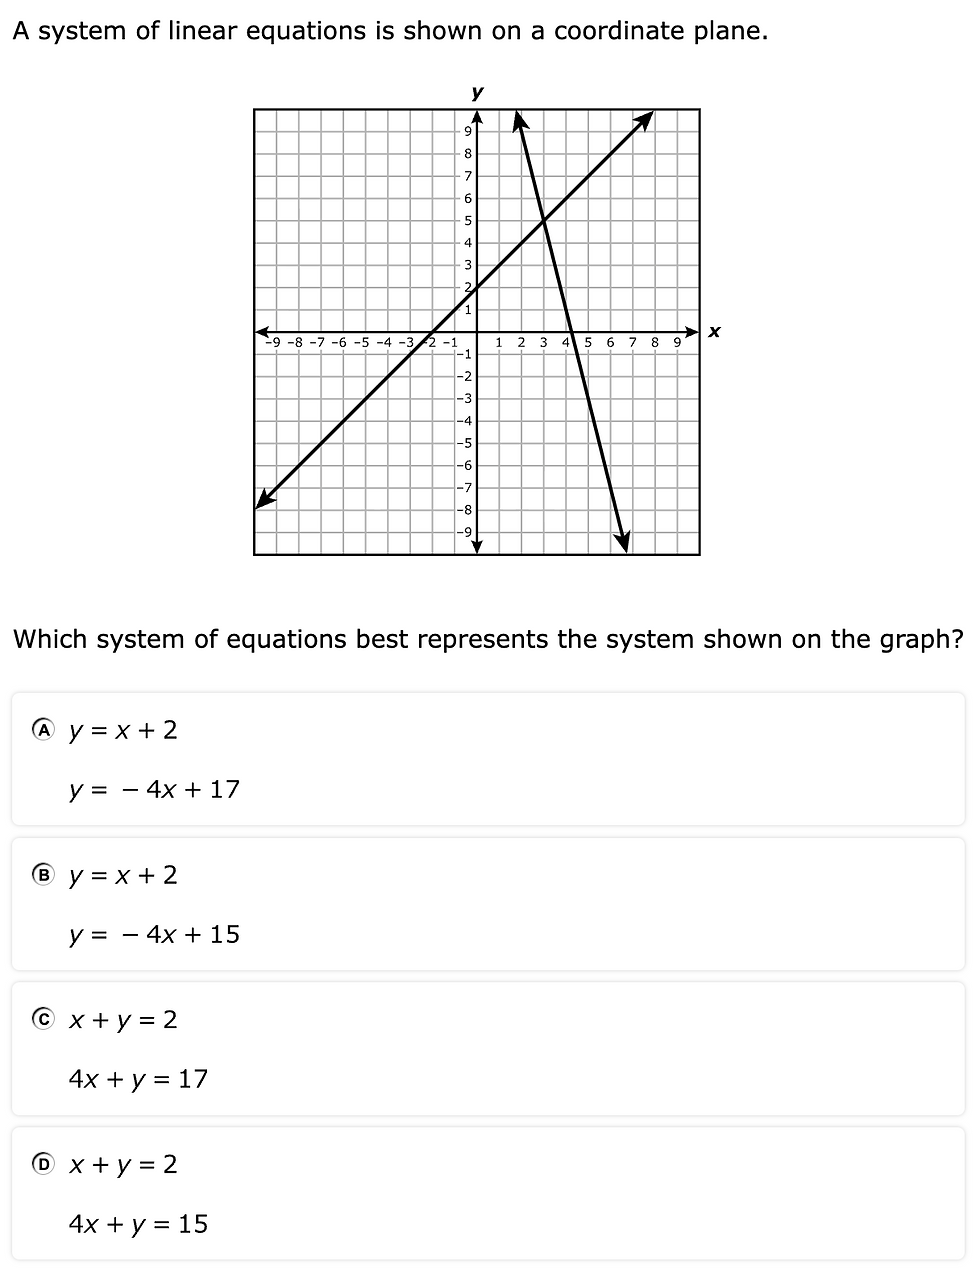
#34 - 34% correct
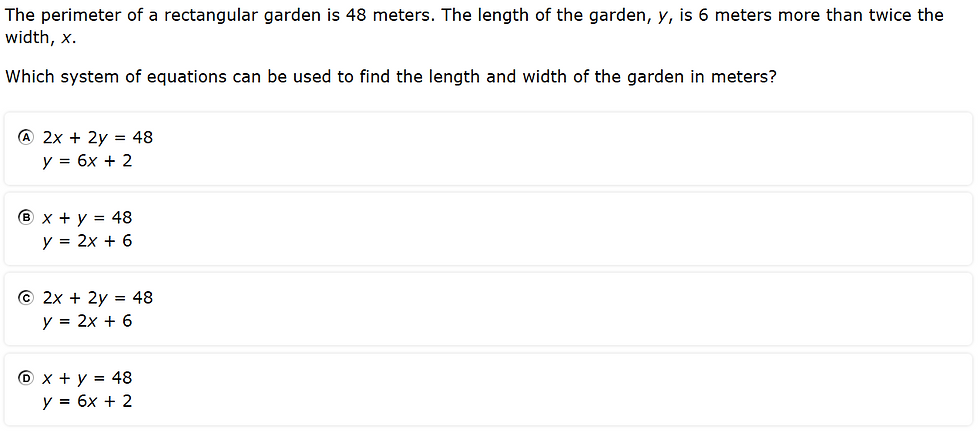
Analysis
The graph on #4 allowed students to potentially use substitution
No equation was given for #34, students had to decipher using the formula for perimeter and the verbal description
The description of the second equation (y is 6 more than twice the width, x) was itself challenging
39% chose B (didn’t double length and width)
Instructional Implications
Generating equations from verbal descriptions increase the rigor
Utilize equations from geometric situations (e.g., area, perimeter) to challenge students
A.5A - 50% overall mastery
solve linear equations in one variable, including those for which the application of the distributive property is necessary and for which variables are included on both sides
#29 - 58% correct

#46 - 42% correct

Analysis
Instructional Implications
Spend time simplifying fractions on both sides with different denominators
Use substitution to verify the solution
A.6A - 51% overall mastery
determine the domain and range of quadratic functions and represent the domain and range using inequalities
#5 - 42% correct

#32 - 60% correct

Analysis
Instructional Implications
Practice ways of identifying features of quadratic functions without graphing (e.g., vertex form)
Identifying the sign of the leading coefficient can eliminate answer choices
A.2A - 53% overall mastery
determine the domain and range of a linear function in mathematical problems; determine reasonable domain and range values for real-world situations, both continuous and discrete; and represent domain and range using inequalities
#16 - 48% correct

#37 - 58% correct

Analysis
Instructional Implications
Continue to equate domain with x and the independent variable
Continue to equate range with y and the dependent variable
For practice, have students describe scenarios in which discrete data would be more appropriate than continuous
A.9C - 53% overall mastery
write exponential functions in the form f(x) = abx (where b is a rational number) to describe problems arising from mathematical and real-world situations, including growth and decay
#18 - 65% correct

#47 - 41% correct

Analysis
Instructional Implications
Reinforce standard form (y = ab^x) and, in interest problems, how to find the b rate (1 + r)
Review the difference between 0.5% and 0.5
A.8A - 54% overall mastery
solve quadratic equations having real solutions by factoring, taking square roots, completing the square, and applying the quadratic formula
#26 - 56% correct

#36 - 34% full credit; 42% partial credit; 25% no credit

Analysis
Instructional Implications
Have students solve equations using two methods at a minimum to increase flexibility
Spend time evaluating problems to identify the most efficient strategy
A.3B - 565% overall mastery
calculate the rate of change of a linear function represented tabularly, graphically, or algebraically in context of mathematical and real-world problems
#13 - 48% correct

#50 - 64% correct

Analysis
Instructional Implications
Refer back to direct variation (k = y/x)
Use formal language (y with respect to x) to increase student awareness
A.9D - 56.5% overall mastery
graph exponential functions that model growth and decay and identify key features, including y- intercept and asymptote, in mathematical and real-world problems
#2 - 79% correct

#33 - 34% correct

Analysis
Little difficulty with #2
Students have never been asked to graph an exponential function on STAAR before (#33)
Students had to select the correct graph and be able to identify two points (e.g, x = 0 and x = 1) to graph correctly
Instructional Implications
Graph exponential functions on paper given a table of values or equation
Practice using the graphing tool on Cambium
A.10E - 57.5% overall mastery
factor, if possible, trinomials with real factors in the form ax^2 + bx + c, including perfect square trinomials of degree two
#20 - 41% correct

#44 - 58% full credit; 31% partial credit; 11% no credit

Analysis
Instructional Implications
When factoring, remove all answer choices or only show one factor to eliminate answering by the distributive property
Remind students to first factor out a common factor (if possible) to simplify the process


Comments