
Algebraic Reasoning: Interpreting Data [TEKS Tools Grade 7]
- Aaron Daffern
- Mar 17
- 2 min read

This post specifically looks at how algebraic reasoning can be used to interpret data representations and make probability predictions. Read more about TEKS Tools and their rationale here.
Algebraic Reasoning
Algebraic reasoning accounts for around 30% of each 7th grade STAAR test. This thinking does not use a visible tool but instead relies on applying algebraic concepts to expressions, equations, and inequalities.
The main function of algebraic reasoning is to identify algebraic relationships in problem situations, interpret data, make predictions, and solve equations and inequalities.
Interpreting Data
Algebraic reasoning can be used to interpret graphs and dot plots.
7.6G - solve problems using data represented in bar graphs, dot plots, and circle graphs, including part-to-whole and part-to-part comparisons and equivalents
2024-21: a dot plot was given, students had to find two supporting statements

2025-15: a dot plot was given, students had to find a false statement

7.12A - compare two groups of numeric data using comparative dot plots or box plots by comparing their shapes, centers, and spreads
Click on each > to expand
2023-10: two box plots were given, students had to find a supporting statement

2024-17: two box plots were given, students had to find a supporting statement

2025-17: two box plots were given, students had to find a supporting statement

7.12C - compare two populations based on data in random samples from these populations, including informal comparative inferences about differences between the two populations
Click on each > to expand
2023-20: two populations were represented on a bar graph, students had to find a supporting statement

Probabilitity and predictions
Probability and predictions can be evaluated and represented algebraically.
7.6H - solve problems using qualitative and quantitative predictions and comparisons from simple experiments
Click on each > to expand
2023-15: a spinner was given, students had to find the correct probability statement

2023-35: a table was given, students had to complete the probability statements

2024-6: a table was given, students had to complete the probability statements

2024-29: a table was given, students had to find the correct probability statement

2025-1: a table was given, students had to find the correct probability statement

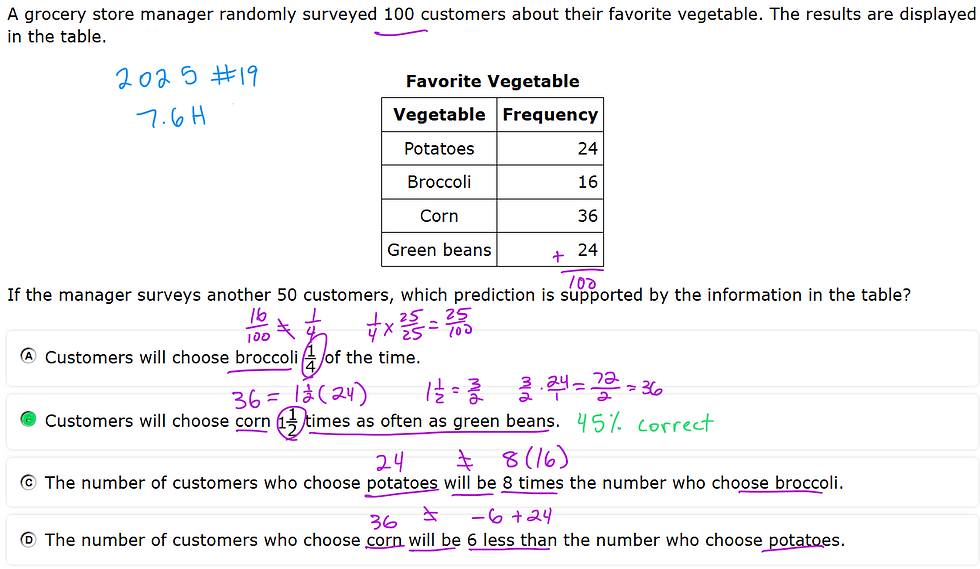
2025-19: a table was given, students had to find the correct probability statement
7.12B - use data from a random sample to make inferences about a population
Click on each > to expand
2024-38: a dot plot was given, students had to make a prediction

Comments